
Last updated: 14 October 2026. Figures use the Nifty 50’s close of 22,625.15 on 14 October.
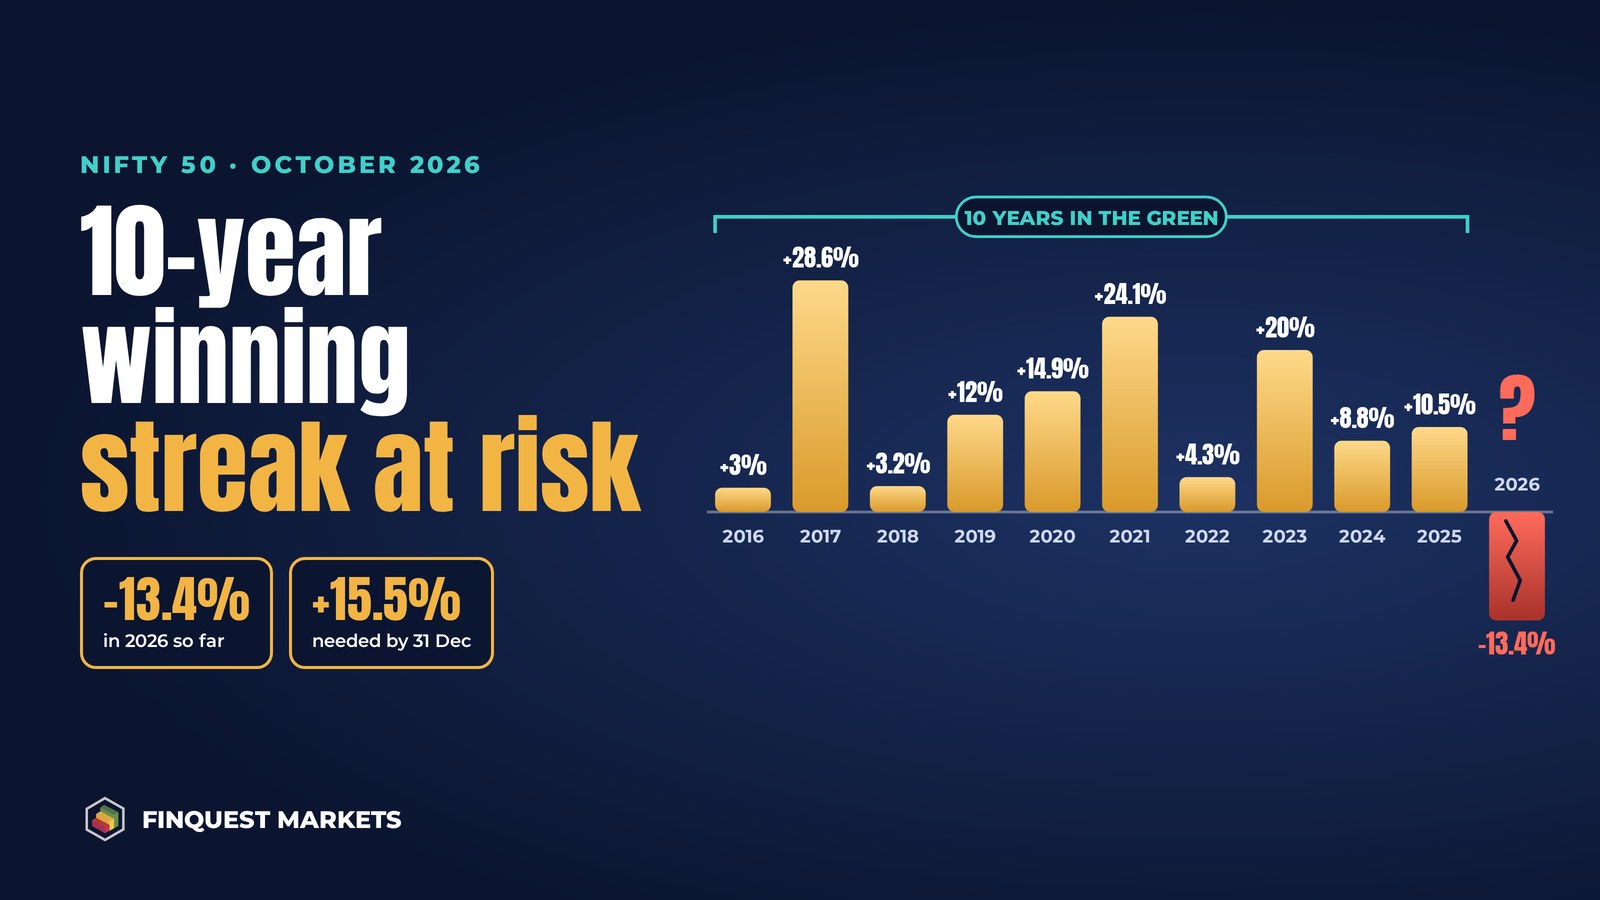
The Nifty 50 has finished every calendar year in positive territory since 2016. That is ten straight years of gains, and the run is now in serious danger. The index ended 2025 at 26,129.60. On 14 October 2026 it closed at 22,625.15, which means it is down about 13.4% this year.
To finish 2026 even slightly positive, the Nifty would need to climb about 15.5% in roughly eleven weeks. If it doesn’t, 2026 will be its first losing year since 2015, and possibly its worst since 2011.
Key takeaways
- The Nifty has risen every year from 2016 to 2025. Its last losing year was 2015, when it fell 4.1%.
- It is down about 13.4% in 2026 so far and needs roughly a 15.5% rally to get back above 26,129.60 by 31 December.
- The main pressures are record foreign selling (about ₹2.5 lakh crore in January–September), crude oil near $100–107 a barrel, high US bond yields, a weak rupee, and a 27% fall in IT stocks.
- Domestic investors have cushioned the fall: institutions bought about ₹6.3 lakh crore and monthly SIP flows are above ₹30,000 crore. Small caps are actually up this year.
Ten years in the green: the streak
| Year | Nifty 50 return |
|---|---|
| 2015 | −4.1% (last losing year) |
| 2016 | +3.0% |
| 2017 | +28.6% |
| 2018 | +3.2% |
| 2019 | +12.0% |
| 2020 | +14.9% |
| 2021 | +24.1% |
| 2022 | +4.3% |
| 2023 | +20.0% |
| 2024 | +8.8% |
| 2025 | +10.5% |
| 2026 (to 14 Oct) | −13.4% |
Notice how close some of those years came. In 2016, 2018 and 2022 the index gained less than 5%, so the streak has survived narrow escapes before. This time the gap is much wider.
How bad is 2026?
- The January–September period was the Nifty’s worst nine months since 2011. That year the index fell 24.6% over the full calendar year.
- By late September the Nifty had closed lower for seven weeks in a row.
- It fell about 6.7% in the September derivatives series, its sharpest drop in a monthly series since September 2001.
- As of early October it was about 14.5% below its September 2024 peak.
There has been some relief this month. On 13 October the Nifty jumped 1.6% to 22,721.95 after strong results from HCLTech and TCS lifted IT stocks, though it slipped again on 14 October.
Why the Nifty is down this year
1. Record foreign selling. Foreign portfolio investors pulled out about ₹2.5 lakh crore ($26.75 billion) from Indian shares between January and September, according to NSDL data. September alone saw outflows of about ₹35,861 crore. Foreign funds mostly hold large caps, so the Nifty has borne the brunt.
2. Expensive oil. Brent crude has risen sharply in 2026 because of the US-Iran conflict, trading around $100–107 a barrel. India imports most of its oil, so high prices feed inflation, squeeze company margins and widen the import bill (our explainer on crude oil and the Indian economy covers the link).
3. High US bond yields. The US 10-year Treasury yield has been around 5.2%. When safe US bonds pay that much, emerging markets like India have to work harder to attract foreign money.
4. A weak rupee. The rupee has traded around 95–97 per dollar. That shrinks returns for foreign investors when they convert back to dollars, which adds to selling (more on the rupee’s fall).
5. The IT sell-off. The Nifty IT index was down about 27% in the first nine months, the biggest drag on the market, on worries that generative AI will eat into outsourcing work. FMCG stocks also fell about 19%. Heavyweights such as Reliance, HDFC Bank and Bharti Airtel dropped 16–27%, and TCS, Infosys, HUL, Maruti, ITC, M&M and HCLTech were down 19–37% over the same period.
What’s holding the market up
- Domestic money. Domestic institutions bought about ₹6.28 lakh crore of shares in January–September, more than double what foreign investors sold. Monthly SIP inflows into mutual funds are above ₹30,000 crore.
- Smaller companies. While the Nifty fell, the Nifty Midcap 100 was roughly flat and the Nifty Smallcap 100 was up about 8–9% over the first nine months.
- Earnings. Profits are still growing: large-cap earnings rose roughly 18–20% in the April–June quarter, with mid and small caps growing faster.
- Cheaper valuations. Because prices fell while profits grew, the Nifty is now valued below its long-term averages. One estimate puts it at about 20.9 times trailing earnings against a 10-year average of about 23; another at about 17 times forward earnings against a 10-year average of 18.9.
Can the streak still be saved?
The maths is simple: the Nifty needs to close 2026 above 26,129.60, about 3,500 points above where it is now. That is a 15.5% climb in around eleven weeks, a big ask for an index of the Nifty’s size.
Market strategists say a recovery depends on a few things going right at once: crude oil prices falling, perhaps through a de-escalation in the US-Iran conflict; US bond yields easing; the rupee stabilising; and foreign investors turning buyers again. Festive-season demand, a pick-up in government spending and solid September-quarter results could help. V K Vijayakumar of Geojit Investments has argued that large caps now look attractive, but that the catch-up will come only once crude and US yields cool.
Without most of those, the more likely outcome is that 2026 ends in the red, breaking the streak.
What it means for investors
A losing year would end an impressive run, but it would not be unusual. Over long periods, stock markets have down years regularly; the Nifty fell in 2008, 2011 and 2015 and went on to new highs each time. The last ten years were the exception, not the rule.
- SIP investors are buying more units at lower prices during a fall, which is how rupee-cost averaging is meant to work. Stopping SIPs in a downturn locks in the lower prices without the recovery.
- Calendar years are arbitrary. Whether the Nifty ends 31 December at 25,900 or 26,200 makes a headline difference but very little practical difference to a long-term investor.
- Diversification has helped this year. Investors holding mid and small caps alongside large caps have done noticeably better than those in Nifty-only funds.
Frequently asked questions
How many years in a row has the Nifty risen?
Ten. The Nifty 50 ended every calendar year from 2016 to 2025 higher than it started. Its last losing year was 2015.
How much is the Nifty down in 2026?
About 13.4% as of 14 October 2026, from 26,129.60 at the end of 2025 to 22,625.15.
What level does the Nifty need to save the streak?
It needs to close 2026 above 26,129.60, roughly 15.5% higher than its 14 October close.
When did the Nifty last have a year this bad?
In 2011, when it fell 24.6%. If 2026 ends near current levels, it will be the Nifty’s worst year since then.
Sources
- Annual returns 2012–2025: Stable Investor
- 2025 closing level: Paytm Money
- 14 October close: SolarQuarter; 13 October rally: Nation Path India
- Worst year since 2011, valuations, domestic flows: Kotak Neo
- Nine-month performance, FPI and DII flows, sector falls, analyst views: Outlook Business
- Fall from peak, September outflows, forward valuations: Shoonya
Disclaimer: This article is for information and education only and is not investment advice. Past returns do not guarantee future performance. Consult a SEBI-registered adviser before making investment decisions.

Leave a Reply